Swarthmore by the Numbers

| Founded | Founded in 1864 as a coeducational college by members of the Religious Society of Friends (Quakers) |
| Character | Private, nonsectarian, liberal arts with engineering |
| Mission | Swarthmore seeks to help its students realize their full intellectual and personal potential combined with a deep sense of ethical and social concern. |
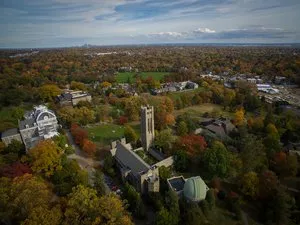
| Campus | 425 acres, comprising the Scott Arboretum, featuring rolling lawns, a creek, wooded hills, and hiking trails |
| Location | Swarthmore, Pennsylvania, 11 miles southwest of Philadelphia |
| Member | Tri-College Consortium with Bryn Mawr and Haverford Colleges, and cross-registration with the University of Pennsylvania |
| Academic programs | Swarthmore offers more than 40 courses of study, and provides the opportunity for students to design their own major. More than 600 courses are offered on campus each year. |
| Honors | A cohort of students chooses to pursue their degree through the College's Honors Program, unique in the U.S., which emphasizes independent learning in small seminar classes and culminates with oral and written tests given by external examiners who are experts in their field. |
| Number of faculty | 173 full-time tenure and tenure-track faculty, 100% of full-time faculty have a terminal degree in their field |
| Student to faculty ratio | 8:1 |
| Students who participate in undergraduate research or independent creative projects | 66%; each summer the College commits more than $800,000 in grants to support this work. Opportunities are available in the humanities, social sciences, natural sciences and engineering divisions, as well as for social action projects. |
| Student Life Information | Totals |
|---|---|
| Residence halls | 18 |
| Students who live on campus | 94% |
| Students who volunteer | ~ 60% |
| Varsity sports teams | 22 |
| Clubs and organizations | 100+ |
| Libraries | 7 |
| Enrollment |
|---|
1,702
Swarthmore welcomes and affirms students from all races, religions, socioeconomic backgrounds, sexual and gender identities, citizenship statuses, and geographic locations. While we make admissions decisions without regard to race, our holistic admissions process considers individuals' lived experience, and our student body represents people from all walks of life. We are committed to building and sustaining a campus environment that is safe for all students, faculty, and staff members. |
| High School Type | Percentage* of Admitted Class of 2028 |
|---|---|
| Independent | 27% |
| Religious | 9% |
| Public and/or charter | 63%, inc. 6% rural |
| Home school | 1% |
| Affiliated with community-based organizations (CBOs)* | 27% |
| Schools abroad | 13% |
*Please note there is overlap in the data for CBOs and schools abroad with other high school types.
| Geographic Location | Percentage of Total Student Body |
|---|---|
| International | 14% |
| Midwest | 7% |
| Middle Atlantic | 37% |
| Mountain States | 3% |
| New England | 7% |
| Southeast | 11% |
| Southwest | 5% |
| West | 14% |
| U.S. Territories | <1% |
| Racial and Ethnic Identity | Percentage of Total Student Body |
|---|---|
| American Indian/Native Alaskan | < 1% |
| Asian | 17% |
| Black or African American | 9% |
| Hispanic | 15% |
| International students | 15% |
| Native Hawaiian/Other Pacific Islander | < 1% |
| Race and ethnicity unknown/unreported | 3% |
| Two or more races | 11% |
| White | 30% |
| Enrollment Information | Totals |
|---|---|
| Number of applicants | 13,065 |
| Number of students admitted | 975 |
| Number of students enrolled | 430 |
| Tuition and Fees | Cost |
|---|---|
| Tuition & Books | $68,766 |
| Housing | $11,076 |
| Food | $10,390 |
| Student activity fee | $460 |
| Total | $90,692 |
Financial Aid
Admission and financial aid decisions for U.S. citizens and permanent residents are made independently at Swarthmore. Financial aid awards meet the determined need for admitted students, without loans.
| Financial Aid | Amount |
|---|---|
| Students receiving need-based aid from the College | 54% |
| Range of financial aid awards | $1,000 - $85,802 |
| Average aid award (campus job and scholarship combined) | $71,465 |
| Outcome | Percentage of Student Body |
|---|---|
| Students who plan to enter the workforce upon graduation | 66.4%^ |
| Students who plan to enter graduate school within 5 years of graduation | 26.4%^ |
| Student & graduate applicants who are admitted to medical school | 78% |
| Student & graduate applicants who are admitted to law school | 80% |
| Graduates who complete a doctoral program | 21.8% (3rd highest in the nation) |
| College Finance | Amount |
|---|---|
| Total operating expenses | $220.2 million |
| Sources of revenue | 37% student fees 55% endowment 5% other |
| Market value of endowment | $2.7 billion |
| Endowment per student | 15th in the U.S.° |
| Impact on Pennsylvania economy | $387.7 million 2,431 jobs |
^ Self-reported survey data from the Class of 2024
° 2024, National Center for Education Statistics
All numbers reflect information for the current academic year unless otherwise noted. The Office of Institutional Effectiveness, Research & Assessment is a source for further statistical information and survey data about Swarthmore College.


